HOME ABOUT ARCHIVES COURSES BLOG SUBSCRIBE   SIGN IN


Bollinger Bands
Donchian Channels
Exponential Moving Average
Keltner Channels
Linear Regression
Parabolic SAR
Price by Volume
Simple Moving Average

print this page
send to a friend

Donchian Channels

Donchian Channels (also called price channels) are simply an “envelope” around a set a pricing data. The top of the channel is the highest high over a given period of time while the bottom of the channel is the lowest low over the same period.

Like other channels, a stock can be traded within the channel from one boundary to the other while watching for “breakouts” in either direction or false breakouts.

As a side note, since the channel top and bottom are the highest high and lowest low of a given time period, it is mathematically impossible for the stock to breakout of the channel because the channel would immediately move if a new extreme price was hit.


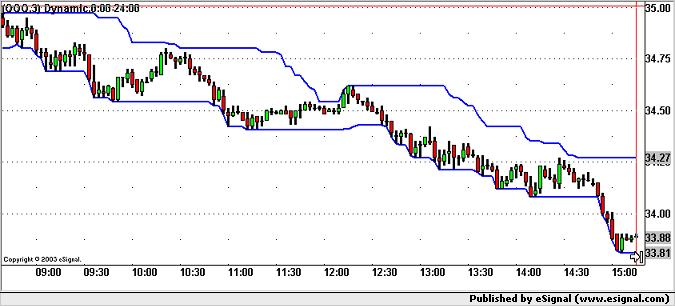
Here is a 3-minute intraday chart of QQQ. First note the stock always stays within the Donchian Channel (it's mathematical - it's impossible to breakout). Overall, when the market is weak, note the tendency for QQQ to "ride" the channel down while occasioanally popping up to touch the top of the channel. The is typical action for a trending day.
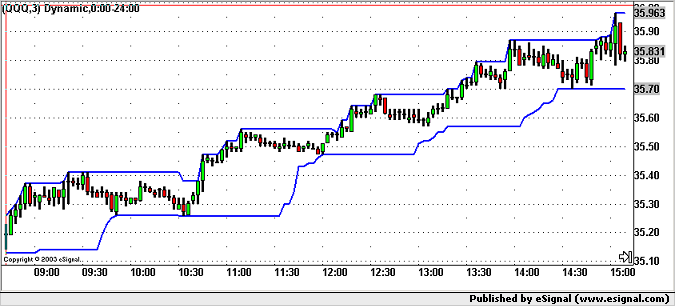


Here again is a 3-minute QQQ chart except the stock is obviously in a steady uptrend. Equal and opposite the bearish action, note the stock's tendency ride the upper part of the channel while occasionally pulling back to kiss the bottom channel line.


» back to top