|
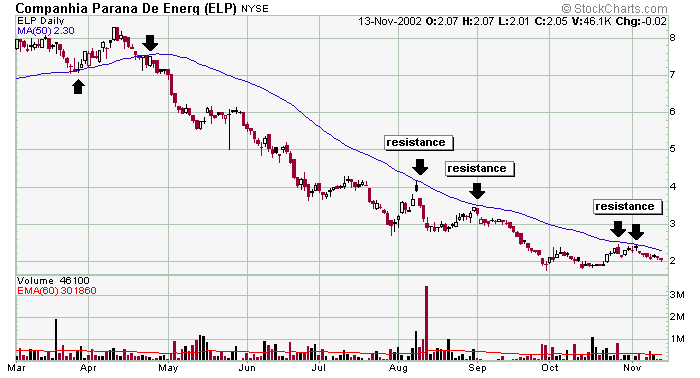
ELP is an example of a weak stock in a steady downtrend whose 50-day moving average posed as resistance each time the stock bounced.
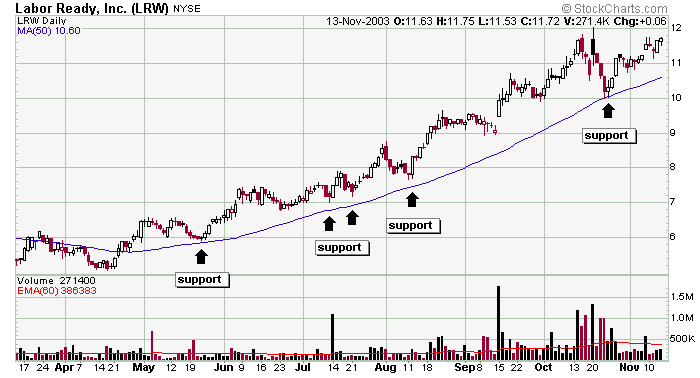
On the other side, LRW used it 50-day moving average as support on this 100% rally off its low.
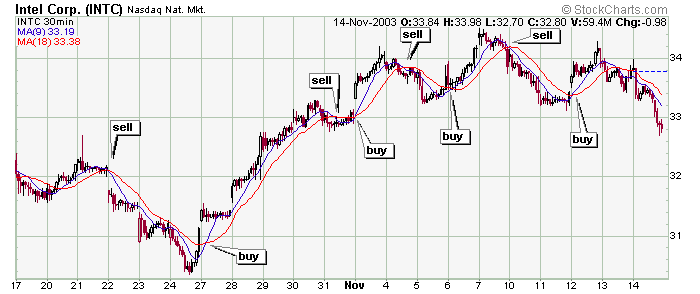
Some traders will plot two different moving averages over a stock chart and use the cross of the longer term moving average by the shorter term MA for buy and sell signals. This type of strategy works well with gently rolling stocks that do not gap, and it worked fairly well with INTC (note this is a 30-minute charts). But don't try this with high beta volatile stocks because too many false signals are suggested.
» back to top
|