|
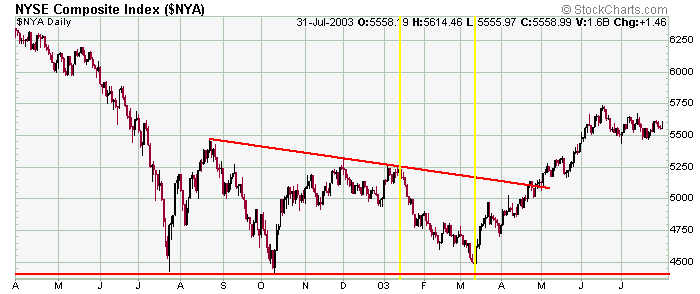
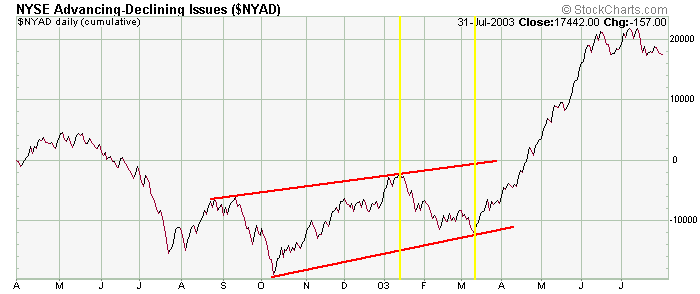
The A/D Line is a long term indicator. The next two chart show an example of a positive divergence that formed between the NYSE and the NYSE A/D Line. While the market was making a series of lower highs during the last half of 2002 and beginning months of 2003, the A/D Line had bottomed and started turning. Strength was building, and the NYSE rally was not far off.
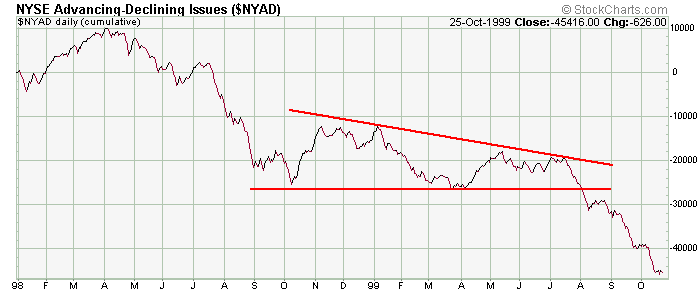
The next two chart show the opposite situation. While the market was steadyily moving up, the A/D Line was making lower highs. Something had to give. Either the market was going to pull back or the A/D Line was going to start moving up. In this case the A/D Line broke support and the NYSE wasn't far behind.

» back to top
|