HOME ABOUT ARCHIVES COURSES BLOG SUBSCRIBE   SIGN IN


Advance/Decline Line
Arms Index (TRIN)
Bullish Percent Index
McClellan Oscillator
McClellan Summation Index
New Highs/New Lows
Put/Call Ratio
VIX and VXO

print this page
send to a friend

New Highs/New Lows

The New Highs-New Lows (NH-NL) indicator is widely followed and used to gauge the market's strength. It is the difference between the number of stocks making 52-week highs versus those making 52-week lows.

When the market is strong the number of stocks making new highs should easily out number those making new lows, and vice versa when the market is weak.

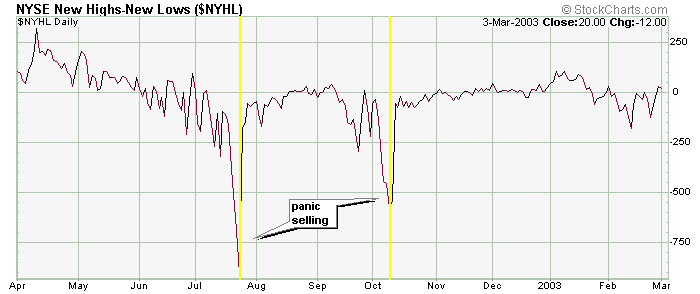
This indicator is most useful in identifying short term overbought or oversold situations. When the NH-NL line spikes up it often indicates a short term top. After all, with so many stocks making new highs, a pullback in the near future would appear likely. On the other side, when the NH-NL line spikes down, it reeks of a capitulation sell-off and often preludes a short-term bottom and market bounce.


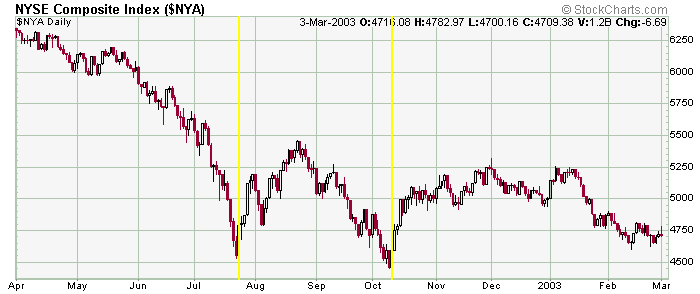
Here is a typical New Highs-New Lows chart. The line typically giggles above and below the zero line while occasionally spiking to an extreme level. You can see from the above chart that each time a bloody capitulation sell-off occured, the market bottomed short term.

These spikes are the only usefulness of the NH-NL line because the line spends so much time going nowhere.


» back to top