|

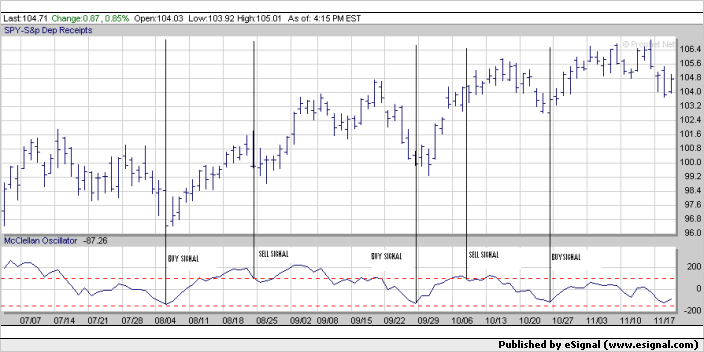
We realize this chart is hard to read, so we'll walk you through it. The bottom line is the McClellan Oscillator. You can see how it basically meanders up and down. The text book use of the oscillator is to buy the underlying issue when the oscillator goes below -70 and then turns up and to sell or sell short when the oscillator goes above 70 and turns down. From the above example, each buy signal was indeed a good signal, but each sell signal merely indicated a pause in the existing uptrend and shorting would have at best been a breakeven proposition.
The opposite scenario probably would exist for a downtrending stock. Sell signals would work great while buy signals merely indicate a pause in the downtrend.
» back to top
|

