|

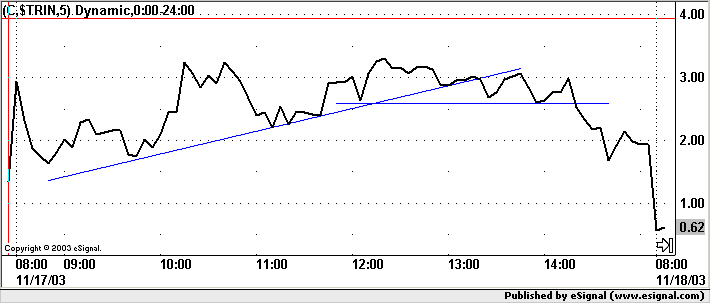
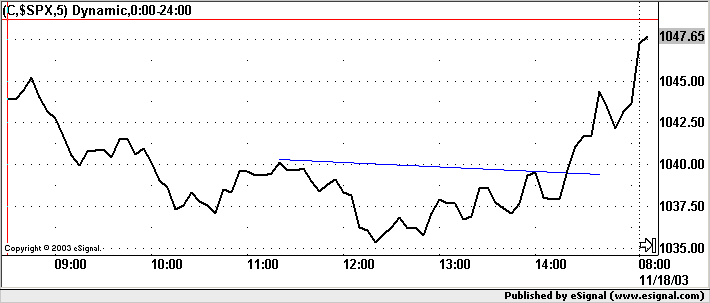
Here is a typical 5-minute indraday TRIN line. Judging by the value most of the day, it's safe to say it was a weak day for the market. But the TRIN's uptrend was broken 2 hours before the close, and then another support line was broken 1 hour before the close. Let's see what happened to the S&P 500 during this day.

As expected the market opened and immediately fell; it spent a majority of the day deep in the red. But when the TRIN topped out around 12:00, the market bottomed. Then when the TRIN broke support around 14:00, the market broke resistance and started to pick up some momentum. New lows for the TRIN was mirrored by new highs for the market.
But as we stated...this is a short term day trader's indicator that should be used with the intraday A/D Line to help determine intraday activity.
The longer term indication given by the TRIN is associated with consistantly high readings. More specifically, if
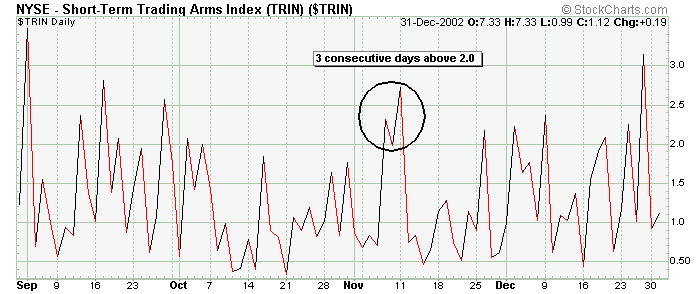
the TRIN closes above 2.0 for 3 consecutive days, history says the market will move up. That doesn't mean it will rally hard; it just means over time, a reading that high for 3 days has resulted in a very solid bounce. Here's an example.

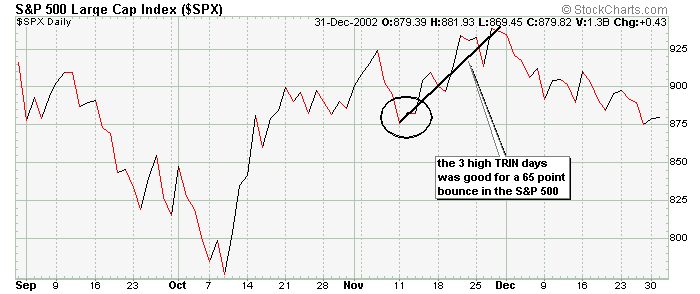
In Nov '02 the TRIN closed 3 consecutive days above 2.0.

The S&P 500 proceeded to bounce 65 points over the following three weeks.
Again, this indicator rarely presents itself...maybe once or twice/year. But when it does, its accuracy is dead on.
» back to top |

