HOME ABOUT ARCHIVES MASTERCLASS BLOG SUBSCRIBE   SIGN IN


Advance/Decline Line
Arms Index (TRIN)
Bullish Percent Index
McClellan Oscillator
McClellan Summation Index
New Highs/New Lows
Put/Call Ratio
VIX and VXO

print this page
send to a friend

VIX and VXO (Volatility Index)

The VIX and VXO have been introduced by the Chicago Board Options Exchange (CBOE). They are hypothetical options that are at-the-money and have 30 days until expiration. They attempt to represent the implied volatility of their respective option. When prices fall, put option buyers are more willing to pay a higher premium, and the VIX and VXO move up. The opposite occurs when stock prices drop. Put buyers are less willing to "pay up" for puts, so the VIX and VXO move down.

The VIX is based on the SPX (S&P 500), and the VXO is based on the OEX (S&P 100).

When the market is weak and falling, the VIX and VXO move up, but when the VIX and VXO spike up to reach extreme levels, the market is thought to be oversold and due for a bounce. On the other hand, when the market is rallying, the VIX and VXO move down. It is believe low VIX and VXO readings can be used to determine short-term market tops.

In the author's opinion, the VIX and VXO do have some value forecasting possible market bottoms when the VIX and VXO spike, but they are utterly useless while the market is strong.


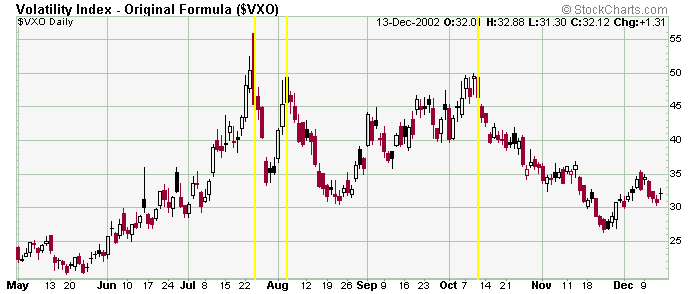
Here is a VXO chart during a 7-month period in late 2002. High readings indicate put option buyers paying a premium, but amateur options players are usually wrong. So high VXO readings, which coorespond to put buyers being wrong at exactly the wrong time should indicate a market bottom.


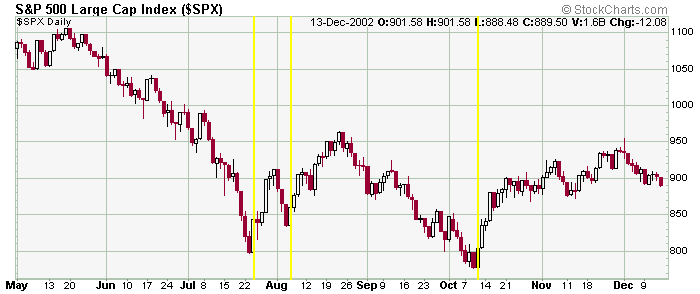
Here is the S&P 500 chart during this same time period. You can see each time the VXO spiked up, the SPX bottomed and bounced.


» back to top