| 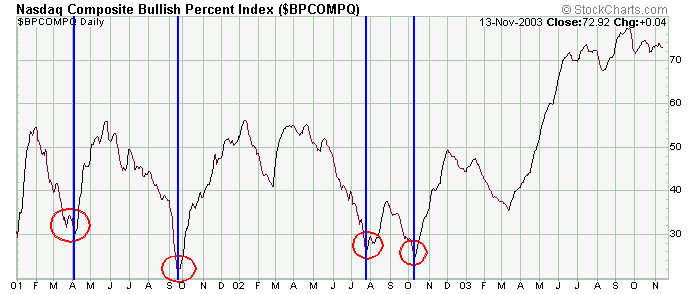
Here is what a typical Bullish Percent Index chart looks like. Since the BPI is the percentage of stocks given a buy signal by their point & figure charts, mathematically the value must stay between 0 and 100.
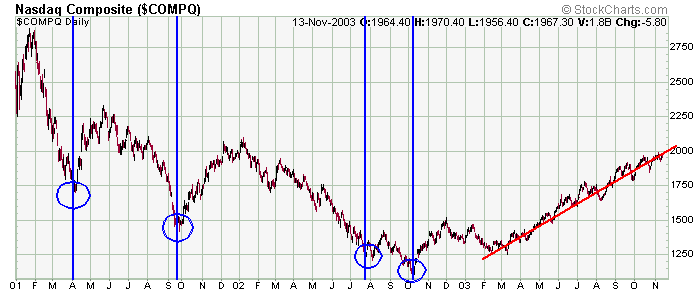
Looking at the above Bullish Percent chart of the NASDAQ, you can see the indicator being pretty good at picking a short term bottom when the BPI drops to around 30 or lower and then moves up. Also note the confirmation of the March to November uptrend by the steadily rising BPI. But don't read too much into the failure of the indicator to make higher highs above 70 when the market continues up - after all there is a ceiling at 100, and realistically it will never get close to that number.
TWR had traded sideways for many months when it formed this 4-month
symmetrical triangle. Notice the volume surge on the breakout as the stock
rallied over 40% in under one week.
» back to top
|