|
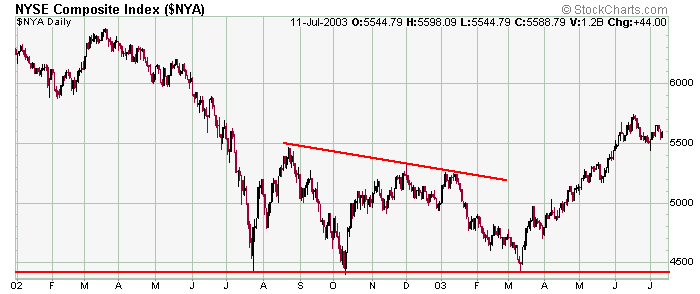
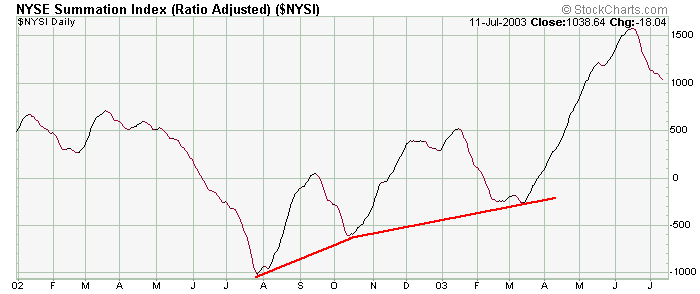
The following two charts exemplify how a positive divergence between an index and its McClellan Summation Index works. Notice the NYSE making a series of lower highs, but the Summation Index made two higher lows. Strength was building, and the NYSE took the lead of the SI and rallied.
» back to top
|