HOME ABOUT ARCHIVES MASTERCLASS BLOG SUBSCRIBE   SIGN IN

Bullish Patterns
Symmetrical Triangles
Ascending Triangles
Rectangles
Pennants
Flags
Wedges
Head & Shoulder Bottom
Cup & Handle
Trendlines

Neutral Patterns
Symmetrical Triangles
Rectangles

Bearish Patterns
Symmetrical Triangles
Descending Triangles
Rectangles
Pennants
Flags
Wedges
Head & Shoulder Top
Trendlines

print this page
send to a friend

Ascending Triangles

Ascending triangles form in uptrends and characterized by a series of higher lows but the same highs. They have a definite bullish bias and typically form in 2 to 8 weeks.


It is as if a massive sell order has been placed at the upper trendline and even though the stock is strong and in an uptrend, it takes some time to fully execute the order. Volume usually diminishes as the pattern develops. Once the overhead supply is absorbed, the stock is free to catapult higher because the lack of supply shifts the supply/demand imbalance to favor the buyers. Also, if indeed a stock is in a steady uptrend, every stockholder who bought in the prior several months will be showing a gain. Satisfied and happy stockholders rarely sell. This reality also helps to push the stock higher after the break.

The best breakouts occur ½ to ¾ on. Breakouts that art art breakouts occur &frac1e delayed until prices crowd into the apex usually fail or are mediocre at best. If by chance a stock trades below the lower trendline, it is not reason to go short. Instead, the trader ought to simply redraw the lower trendline and keep watching for an eventual break to the upside. This act of redrawing a trendline is pretty common. Remember, drawing trendlines is a subjective art at best. They are the trader's best guess as to where support and resistance could be or should be, so redrawing them is perfectly permissible.

Breakouts should be accompanied by a significant increase in volume. Failure to accomplish this doesn't render the breakout invalid, but a red flag is raised and appropriate stops should be employed.

There are two guidelines a trader can use to determine the extent of the rally upon breakout. The first expected price movement is approximately equal to the widest part of the pattern. The second price target is equal to the rally into the pattern. The extent of the advance will often depend on the overall market. A strong market will help greatly in achieving the more ambitious price target, but in a weak market, a trader should be happy with just a moderate advance.


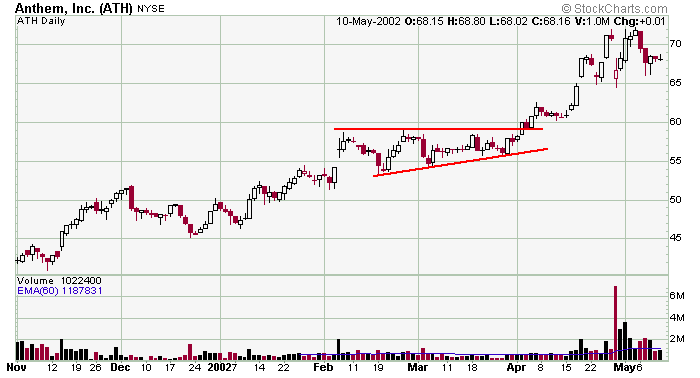
ATH was in a steady uptrend when it consolidated in an ascending triangle pattern. Resistance is not perfectly defined but the series of higher lows maintains the generally upward nature of the stock. Volume didn't exactly surge on the breakout, but the stock didn't pullback much so there was never a reason to get out (remember, volume is used as a confirmation – not a decision-making element). Eventually the bulls stepped up and provided a nice gain for those patient enough to stay with the position.


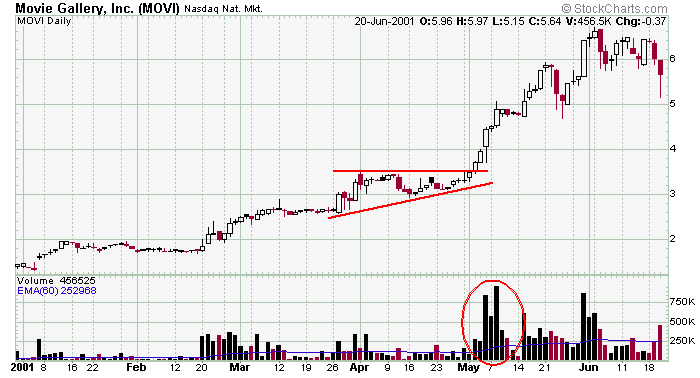
This is a textbook play for MOVI. Volume surge on the move into the pattern and then calmed down within the pattern. Then volume surged again on the breakout. This is exactly the type of action you want to see.


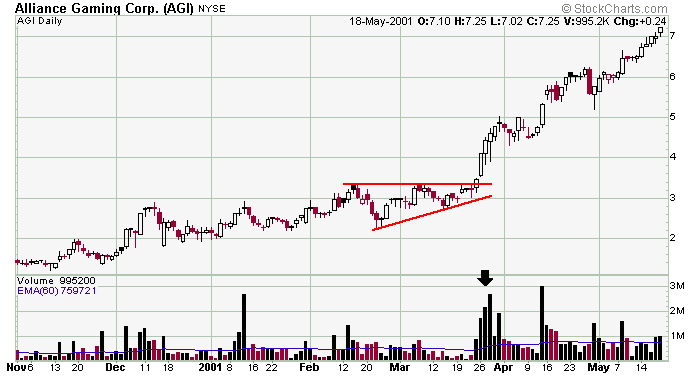
AGI was in a steady uptrend when it traded into and then exploded out of this ascending triangle pattern. Notice how resistance is very easy to determine (always a bonus when it's exact, and you don't have to estimate) and how volume dried up just prior to the breakout.


» back to top