HOME ABOUT ARCHIVES COURSES BLOG SUBSCRIBE   SIGN IN

Bullish Patterns
Symmetrical Triangles
Ascending Triangles
Rectangles
Pennants
Flags
Wedges
Head & Shoulder Bottom
Cup & Handle
Trendlines

Neutral Patterns
Symmetrical Triangles
Rectangles

Bearish Patterns
Symmetrical Triangles
Descending Triangles
Rectangles
Pennants
Flags
Wedges
Head & Shoulder Top
Trendlines

print this page
send to a friend

Descending Triangles

Descending triangles form in downtrends and are characterized by a series of lower highs but the same lows. They have a definite bearish bias and typically form in 2 to 8 weeks.

It is as if a massive buy order has been placed at the lower trendline, and even though the stock is weak and in a downtrend, it takes some time to fully execute the order. Volume usually diminishes as the pattern develops. Once the underneath demand is absorbed, a big drop in the stock can occur because the lack of demand shifts the supply/demand imbalance to favor the sellers. Also, given this is a weak stock in a steady downtrend, when support is broken, every stockholder who recently established a long position in the prior several months shows a loss. So besides the large buy order being absorbed, fear now sets in and adds to the downward pressure.

The best breakdowns occur ½ to ¾ of the way through the pattern. Breakdowns that are delayed until prices crowd into the apex usually fail or are mediocre at best. Similar in concept to ascending triangles, if a stock forming a descending triangle were to trade up through its upper trendline opposite the overall trend, then the trendline should be redrawn, and the stock is still playable as a short when support is broken.

Like symmetrical triangles, downside breaks do not have strict volume requirements. The best downside breaks occur on average volume followed by the stock drifting lower for a few days. Volume then ramps up as traders throw in the towel, and the stock crashes.

There are two guidelines a trader can use to determine the extent of the fall after the break. The first expected price movement is approximately equal to the widest part of the pattern. The second price target is equal to the price movement into the pattern. The drop will often depend on the overall market. A weak market will help push the stock lower, but a strong market may slow or stop the descent.


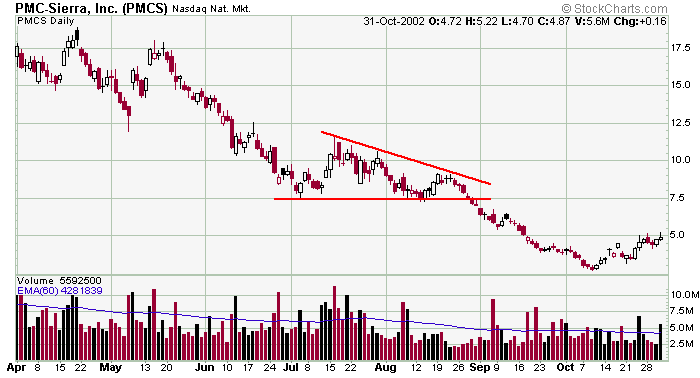
PMCS formed a pretty simple descending triangle pattern. Volume was big into the pattern and the first couple weeks of the pattern's formation and then fell off noticeably right before support was penetrated. The move we got on the downside was approx. equal to the size of the triangle, and that is what you can expect as long as the overall market cooperates.


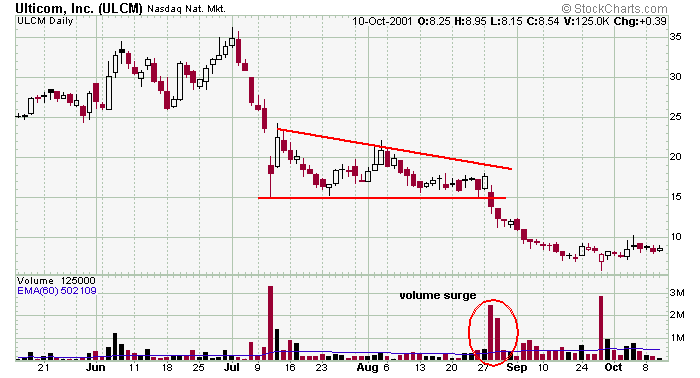
ULCM sold off big time and then traded sideways into a descending triangle pattern. Notice the volume surge on the break and the steady down volume that lasted several weeks. As an added bonus, it's nice when support is a whole number like 15. That makes it easier to play.


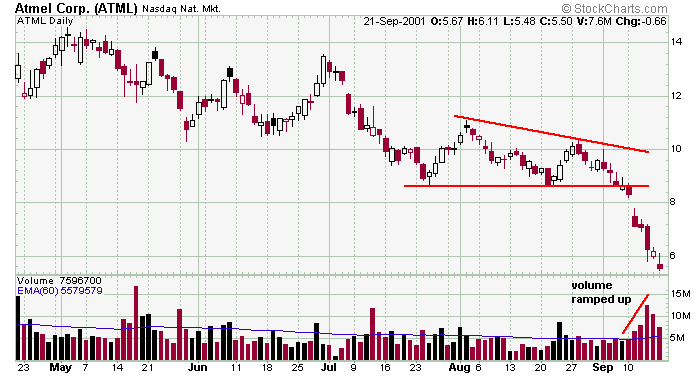
Here is a good example of volume ramping up after support is penetrated. When the stock first breaks down, stockholders start to get worried and some sell. As the stock continues down, general concern turns to fear which then turns to an outright panic, and the volume ramps up exactly as seen here.


» back to top