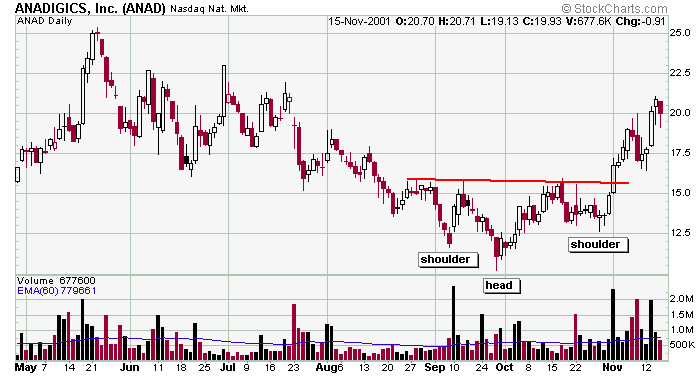
Head & shoulder bottom patterns rarely fit the textbook description, and ANAD is a good example of that. Typically you'd like the pattern to be bigger, but in this case the neckline was fairly easy to determine and the volume surge on the breakout sealed the deal. Absent the volume surge, the stock most likely would have pulled right back into the pattern.
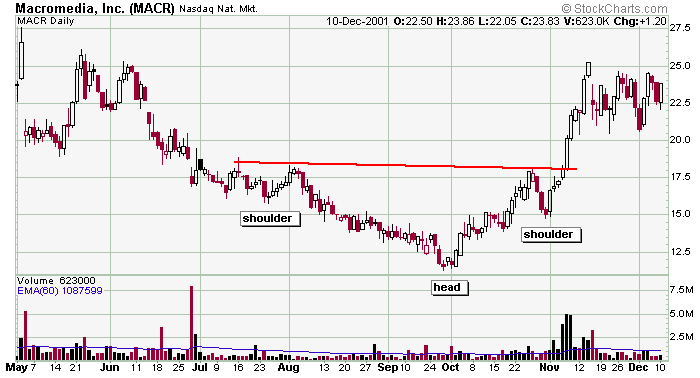
MACR formed a nice head & shoulder bottom pattern in the fall of 2001. Notice the volume pick up on the right side of the head, and fall off on the left side of the right shoulder. The volume surged when the stock exploded out of the pattern.
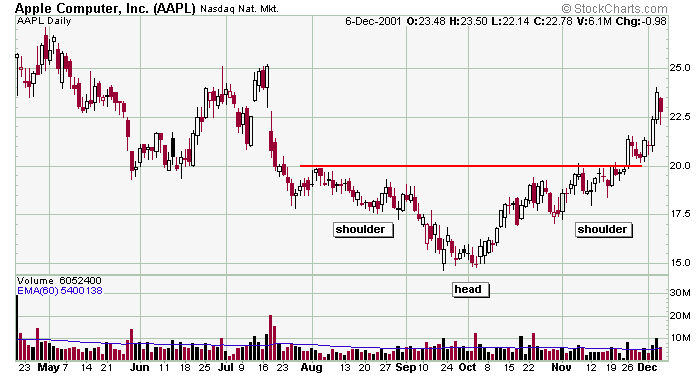
Whole numbers are often significant numbers, so when AAPL formed a head & shoulder bottom pattern with its neckline at 20, the astute trader needs to pay more attention. The move down into the pattern was 5 points (from 25 down to 20) and the size of the head was 5 points (15 to 20), so the projected move out of the pattern was 5 points (from 20 to 25). We didn't quite get it (probably because there wasn't much volume on the breakout), but we did get a nice 20% move nevertheless.
» back to top |