Cup & Handle
Cup & handle patterns are powerful and reliable continuation patterns that form in uptrends and therefore have bullish implications. Their completion signals the end of a consolidation period and the continuation of its bullish uptrend.
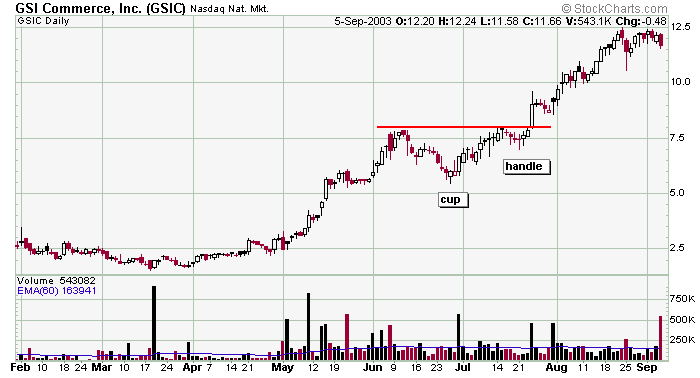
The above chart illustrates the sequence of events that unfold as the pattern develops. After a nice rally (preferably on solid volume), the stock begins a long drawn out correction. When the pullback begins, many stockholders decide that after the nice rally, they now would like to take profits up near the peak. There were also many late-to-the-party buyers who bought at the peak, and as the stock starts to drop, these stockholders have one thing on their mind – to “get out even.” These two groups will create selling pressure when the stock regains strength. Months later when the stock trades close to the first peak, stockholders jump at the opportunity and start selling. Thus a second pullback begins. A line drawn through the two peaks forms a trendline. This second pullback is very healthy and normal for a strong stock or a stock that is gaining strength. Since stock movements have such a large psychological component to them, it is unlikely the stock will enjoy any type of rally as long as there exists many disgruntled stockholders. It takes time to weed out these weak links. Once enough time has passed (the formation of the handle), the stock is free to move higher for there is now an absence of stockholders who will sell at the first good opportunity.
The trendline should be flat or slightly downward sloping. Cup & handle patterns usually take several months and sometimes over a year to form.
The best patterns possess a decent amount of symmetry with the right half of the cup mirroring the left half and the right half of the handle mirroring the left half. But while it is nice for the pattern to have a smooth even balance, it is not absolutely necessary. Also, it is important that the handle not go below the midpoint of the cup. Theoretically, only the selling to satisfy the people who want to get out near the previous high needs to take place. But if the stock drops below the midpoint of the cup, it is a warning that more selling is taking place than simply a handful of panicky holders.
It is not unlikely, and perhaps common, for 2 handles to form, so anticipating the breakout and entering a position early is not a good idea. This is healthy for the stock and is simply an indication that a little more “work” is needed to allow the weak stockholders to get out.
The same breakout requirements govern as with other breakouts. Volume must surge to validate the breakout, and appropriate stops shall be implemented if volume is not satisfactory.
There are two guidelines a trader can use to determine the expected price movement upon breakout. The first is the equal to the depth of the cup. The second is the price movement into the first peak. Often the strength or weakness of the overall market will dictate the success of the pattern.
|