Head & Shoulder Top
A bearish head & shoulders top is a powerful and reliable reversal pattern that appears as a large distribution period after a significant uptrend . Its completion signals a trend reversal. Three successive peaks characterize the pattern with the middle one being the tallest and the two outside ones being shorter and approximately equal.

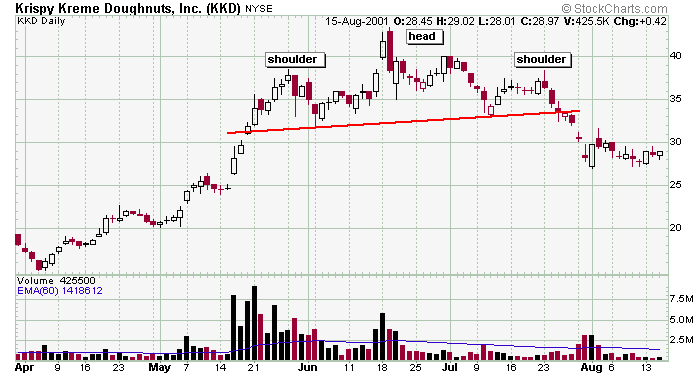
The above chart illustrates the sequences of events that unfold as the pattern develops. The left shoulder is formed as just another peak and correction within a long uptrend. The stock then rallies and makes another higher high. This action, which forms the left shoulder and first half of the head is no different than what is expected with a stock in a typical uptrend. And at this point in time, there is no way for the trader to know that a head & shoulders is forming. The stock then begins its usual “pullback within an uptrend,” but not only does the stock trade below the left shoulder, it falls to, or close to, the same level as the previous pullback. The head has now been formed. This is the first sign that the buyers may be getting tired and the stock seems to be losing strength. A trendline, called the neckline, can be drawn between the two troughs. The stock then rallies again but is unable to eclipse its previous high. This is the second sign the uptrend may be nearing an end. A sell-off from this shorter peak (right shoulder) through the neckline would mark a successful reversal of the uptrend.
There is a tendency for a head & shoulders to develop a high degree of symmetry. This is amazing considering all the news and events and “things” that can influence a stock's price on a day-to-day basis. Some traders demand symmetry and only consider the pattern valid if the two shoulders are equal in size and duration. However, although this is desired and the pattern may have a very satisfying balance, it is not necessary. A perfectly symmetrical head & shoulders pattern doesn't happen often. There usually is some distortion or variation (such as the formation of a second right shoulder) in the pattern, and since chart reading is an art, there will always remain a subjective human aspect to the analysis.
The neckline should be flat or slightly upward sloping. Downward sloping necklines do occasionally occur, but their existence indicates negativeness is slowly working itself into the stock and a large correction is probably not imminent. In this case, the trader ought to look elsewhere for trading opportunities.
Breakouts to the downside do not have the same volume or movement requirements as their bullish counterparts. In fact, when stock breaks support with a massive volume surge, it often signals that of a capitulation sell-off and the stock rebounds shortly after. The best downside breaks occur on average volume followed by the stock drifting lower for a few days on increasing volume. Psychologically, when a stock first breaks support, stockholders become concerned; many of them show a loss and some sell. As the stock trades lower, concern becomes fear and the selling accelerates. Then fear becomes panic, and people sell regardless of price. This is why there typically is a delayed volume surge with breaks to the downside.
The character and extent of the expected price movement upon breakage depends on several factors. Typically it is equal to the distance from the neckline to the extreme point of the head. But this is just a guideline. Head and shoulders is a reversal pattern, so there must be a significant move to reverse. A small move into the pattern usually results in a small drop upon break. Also, the drop tends to be the mirror image of the preceding rally. This means a quick rally full of energy foreshadows a quick drop.
Duration of the entire pattern (i.e. how long the stock trades above the neckline) also plays a role. There is an old adage on Wall St. that reads “the bigger the top, the bigger the drop.” The extent and speed of the drop will be related to the extreme imbalance between the buyers and sellers. A lengthy pattern suggests many people bought the stock above the neckline, and it is these late-to-the-party buyers who will provide much of the selling pressure when the stock breaks support.
Whether a stock bounces back to the neckline after breaking support can depend on the overall market. If the entire market is weak, there probably will be no bounce. If on the other hand the market is trending up at the same time a stock completes its pattern, then a bounce is likely.
A Head & shoulders top that breaks through its neckline almost always experiences a significant drop; a failed head & shoulders top is almost never the beginning of a large rally. However, the stock, which now appears cheap, may attract buyers, so a second right shoulder may form, but in the end, the most likely scenario is an eventual drop.
|