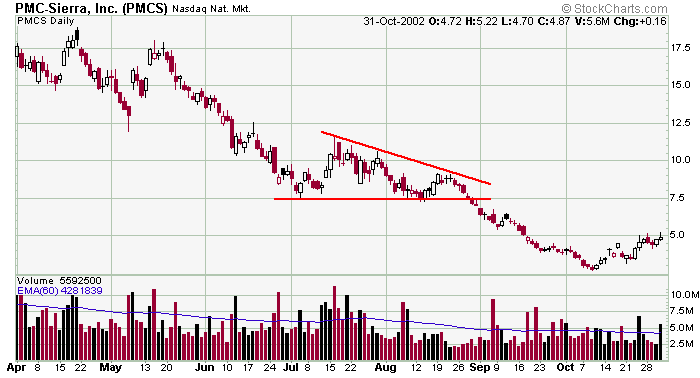
PMCS formed a pretty simple descending triangle pattern. Volume was big into the pattern and the first couple weeks of the pattern's formation and then fell off noticeably right before support was penetrated. The move we got on the downside was approx. equal to the size of the triangle, and that is what you can expect as long as the overall market cooperates.

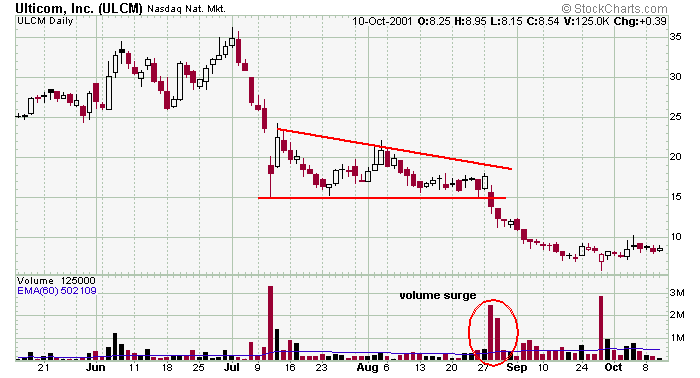
ULCM sold off big time and then traded sideways into a descending triangle pattern. Notice the volume surge on the break and the steady down volume that lasted several weeks. As an added bonus, it's nice when support is a whole number like 15. That makes it easier to play.

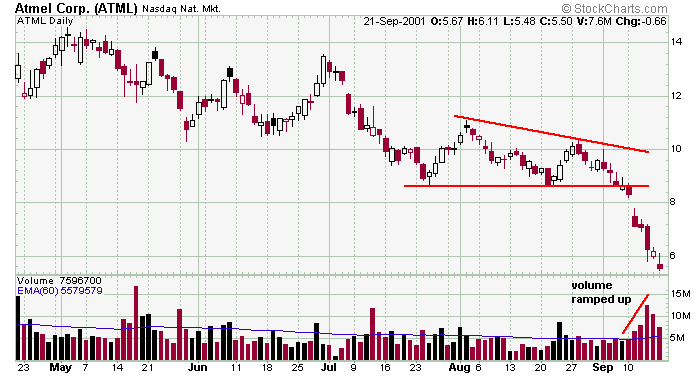
Here is a good example of volume ramping up after support is penetrated. When the stock first breaks down, stockholders start to get worried and some sell. As the stock continues down, general concern turns to fear which then turns to an outright panic, and the volume ramps up exactly as seen here.
» back to top |

