HOME ABOUT ARCHIVES MASTERCLASS BLOG SUBSCRIBE   SIGN IN


Accumulation/Distribution Line
ADX (Wilder's DMI)
Average True Range (ATR)
Chaikin Money Flow (CMF)
Chaikin Oscillator
Commodity Channel Index (CCI)
Comparative Relative Strength
MACD
MACD Histogram
Momentum
On Balance Volume (OBV)
Price Oscillator (PPO)
Rate of Change (ROC)
Relative Strength Index (RSI)
Stochastic Oscillator
Volume
Volume Oscillator (PVO)
Williams %R

print this page
send to a friend

ADX (Wilder's DMI -
Directional Movement Index)


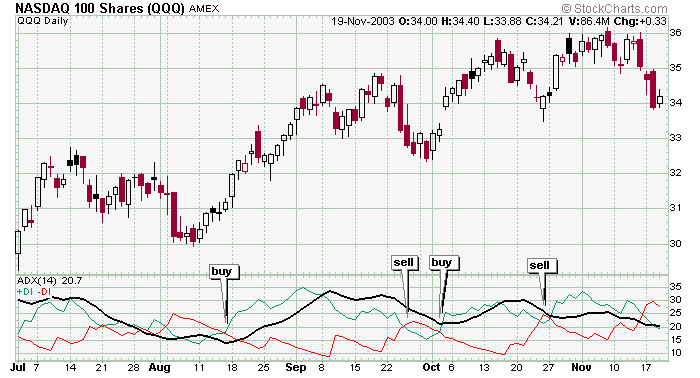
The Directional Movement is a trading system developed by Welles Wilder to help determine if a stock is trending. The system involves the 14-day +DI (directional indicator) and the 14-day -DI. Wilder suggested buying when +DI rises above -DI and selling when +DI falls below -DI.

But this overly simplified suggestion offered many false signals, so Wilder went a step further. He then suggested noting the high of the day when the +DI crosses over the -DI and only buying when prices eclipse this high. Likewise he suggested noting the low of the day when the +DI crossed below the -DI and to only sell when the stock made a new low.


Here is a simplified usage of ADX. When the line (the black line) is high, an indication is made the underlying issue is trending and may be playable for a trend trade. But when the ADX value is low, the underlying issue is churning sideways and is only playable by day traders.


This QQQ chart shows examples as to how ADX can be used to offer buy and sell signals. A buy signal is given when the +DI line (green line) crosses up through the -DI line (red line) and the ADX line (black line) is also trading above the -DI line. A sell signal is given when the +DI line crosses below the -DI line. If this strategy was employed on the above chart, results would have been pretty good.


» back to top