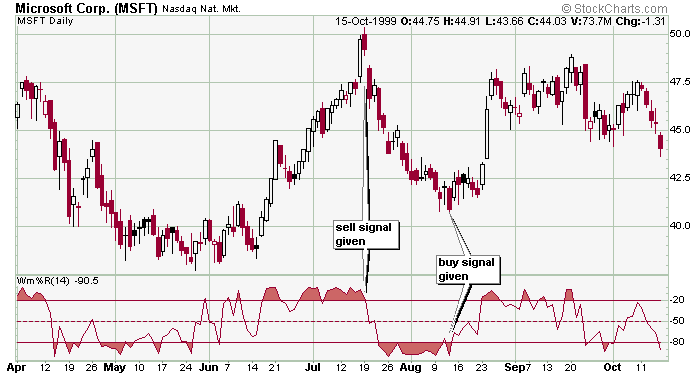
HOME ABOUT ARCHIVES MASTERCLASS BLOG SUBSCRIBE   SIGN IN


Accumulation/Distribution Line
ADX (Wilder's DMI)
Average True Range (ATR)
Chaikin Money Flow (CMF)
Chaikin Oscillator
Commodity Channel Index (CCI)
Comparative Relative Strength
MACD
MACD Histogram
Momentum
On Balance Volume (OBV)
Price Oscillator (PPO)
Rate of Change (ROC)
Relative Strength Index (RSI)
Stochastic Oscillator
Volume
Volume Oscillator (PVO)
Williams %R

print this page
send to a friend

Williams %R

Williams %R (pronounced “percent R”) is a momentum indicator developed by Larry Williams. It oscillates between 0 and -100. Readings in the -80 to -100 range indicate an oversold condition while readings in the 0 to -20 range indicate an overbought condition.

Like many “overbought/oversold” oscillators it is best to wait for the underlying's price to change direction and for the indicator to reverse course to confirm the move.

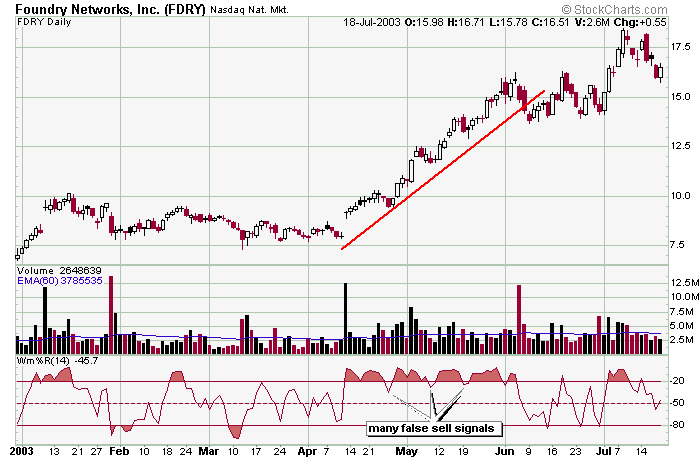
The percent R has been known to be very good at reversing a few days before prices do (i.e. it peaks a few days before a top is achieved and bottoms a few days before the underlying reverses). But it is not uncommon for an overbought or oversold indicator to stay overbought or oversold for a long period of time, so one needs to study the history of the percent R with a stock to determine its tendencies.


Here is a simple example as to how Percent R can be used as an overbought or oversold indicator. After a big rally in June and July which saw the Percent R get into overbought territory and generally stay there, a sell signal was given when the indicator moved down. Then, after falling for 4 weeks an seeing the Percent R move into oversold territory and stay there, the indicator moved up, and the stock bounced soon after.


Here is an example many false sell signals being given by Percent R. No indicator works all the time, and some indicators work better with some stocks than others. The prudent trader never blindly relies on any one technical indicator.


» back to top