HOME ABOUT ARCHIVES MASTERCLASS BLOG SUBSCRIBE   SIGN IN


Accumulation/Distribution Line
ADX (Wilder's DMI)
Average True Range (ATR)
Chaikin Money Flow (CMF)
Chaikin Oscillator
Commodity Channel Index (CCI)
Comparative Relative Strength
MACD
MACD Histogram
Momentum
On Balance Volume (OBV)
Price Oscillator (PPO)
Rate of Change (ROC)
Relative Strength Index (RSI)
Stochastic Oscillator
Volume
Volume Oscillator (PVO)
Williams %R

print this page
send to a friend

Comparative Relative Strength

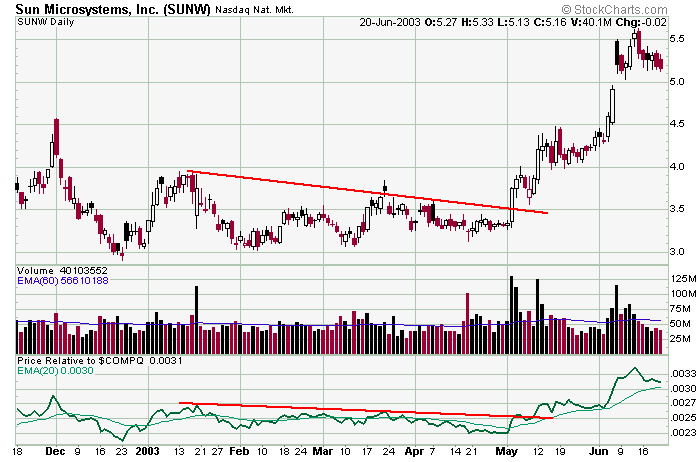
Comparative Relative Strength simply compares the price of one security with the price of another security or an index. It is most often used to compare a stock with an index or the sector to which it belongs.

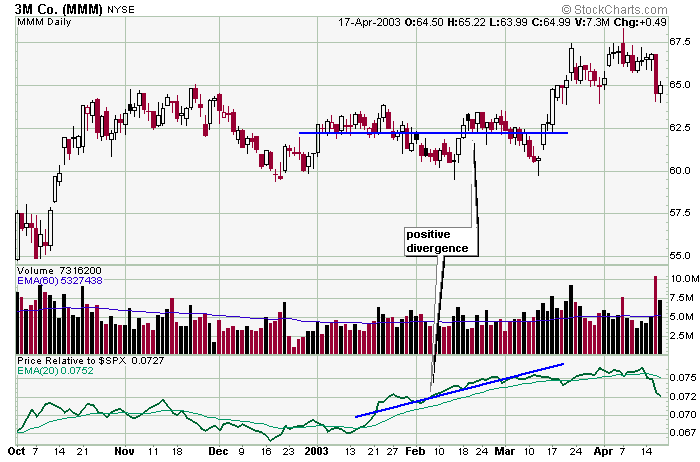
When the market or an individual sector is trending up, traders like to concentrate their buying in the strongest stocks, and Price Relative helps to identify which stocks are leading.

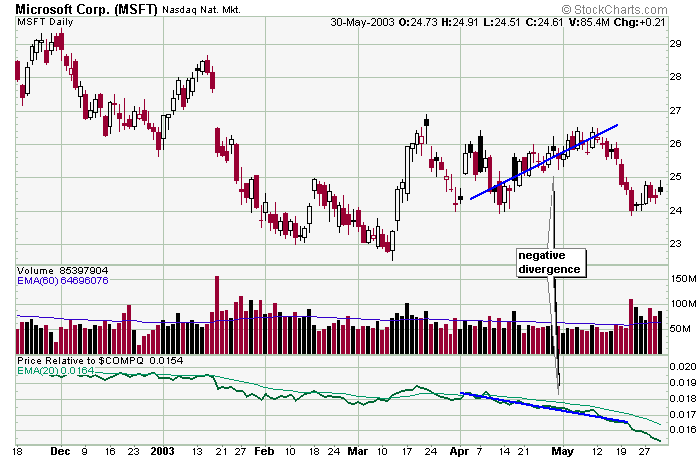
When the market or an individual sector is trending down, traders like to concentrate their shorting in the weakest stocks, and Price Relative helps to identify which stocks are lagging.


This chart shows that although MSFT was moving up, it was moving up at a much slower rate than the NASDAQ. Since the stock was so weak compared to the NASDAQ, all it takes is a little Nas pullback for the stock to fall hard.


Here is an example of MMM holding on strong while the market was falling. Despite the market weakness, MMM held tight, and when the market bounced, being one of the stronger stocks, MMM took off.


Here is an example of a trendline berakout being used on an indicator. SUNW was underperforming the NASDAQ, but then "broke out" and the stock did the same. This shows a shift is strength. The stock went from underperforming to outperforming and that's enough to at least demand a look.


» back to top