HOME ABOUT ARCHIVES COURSES BLOG SUBSCRIBE   SIGN IN


Accumulation/Distribution Line
ADX (Wilder's DMI)
Average True Range (ATR)
Chaikin Money Flow (CMF)
Chaikin Oscillator
Commodity Channel Index (CCI)
Comparative Relative Strength
MACD
MACD Histogram
Momentum
On Balance Volume (OBV)
Price Oscillator (PPO)
Rate of Change (ROC)
Relative Strength Index (RSI)
Stochastic Oscillator
Volume
Volume Oscillator (PVO)
Williams %R

print this page
send to a friend

MACD

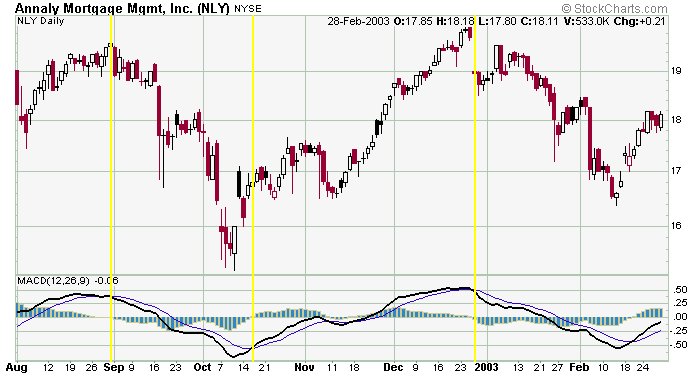
The MACD (moving average convergence/divergence) was developed by Gerald Appel. It is a momentum indicator that plots the difference between two moving averages (the 26-day and 12-day EMAs are most often used) and a third MA (usually the 9-day EMA). This 3 rd MA is the signal or reference line.

The MACD is most effective in wide-swinging trending markets and tends to lag price movements. It has a couple popular uses.

•  Crossovers – some traders will buy when the MACD crosses over it's signal line and sell or sell short when it cross down through its signal line. They will also look to buy and sell when the MACD crosses up or down through the zero line.

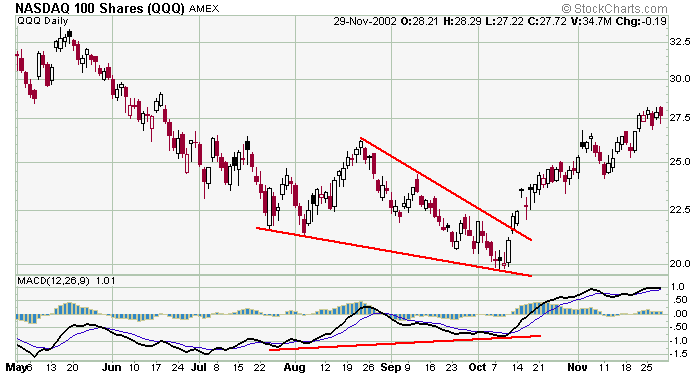
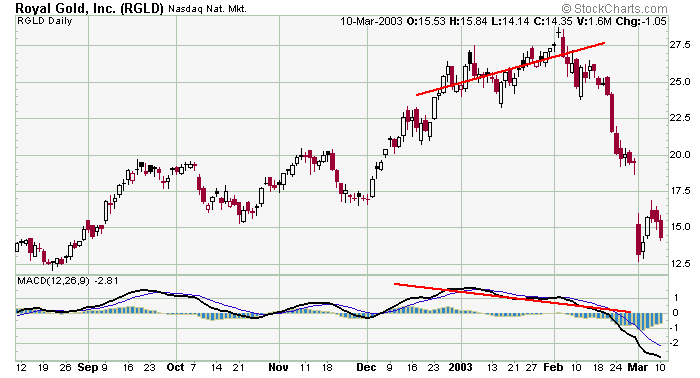
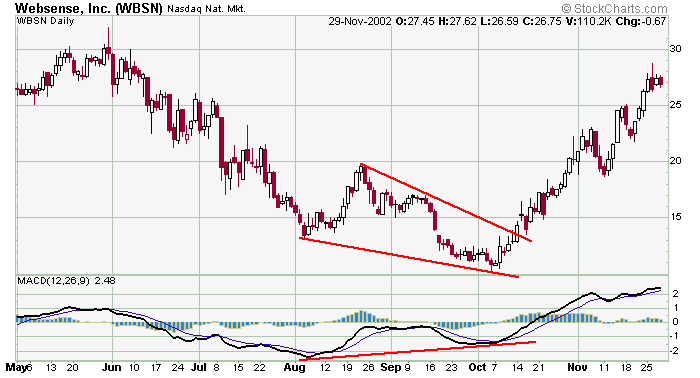
•  Divergence – The MACD will generally lag the underlying price slightly (i.e. when a stock moves up so will the MACD but slightly delayed), but when a divergence occurs where the MACD fails to confirm the underlying issue's movement, the stock price typically reverses. So if a stock is rallying and the MACD tops out and starts to head down, a big hint is being given that the stock , too , will top out soon. On the other hand, if a stock falls but the MACD flattens out and starts to move up, a near-term bottom in the stock is likely.


Here is an example of how MACD is often used to determine entries and exits. A buy signal is given when the shorter term line (the black line) crosses up through the longer term line (the blue line). This occurred in mid October. A sell signal is offered when a cross happens to the downside. Using this strategy, you entries and exits would have been pretty good.


Here is an example of a positive divergence with the MACD. QQQ was trending down, but its MACD bottomed and maded a higher low. The indicator led, and the stock turned around and moved up.


RGLD formed a negative divergence. While the stock was moving up, its MACD was moving down, and when this happens, the indicator often wins. RGLD did indeed pull back.


This WBSN chart demonstrates a positive divergence.


» back to top