CMF (Chaikin Money Flow
)

The Chaikin Money Flow (CMF) was developed by Marc Chaikin to determine the degree to which money was flowing into or out of a security. But before we delve into a description, a little background information is needed.
Joe Granville came first with his On Balance Volume (OBV) indicator. It compared a stock's closing price with its previous day's close and either added or subtracted the volume if the stock was up or down respectively.
Larry Williams came next. He improved (this is subjective) the OBV by comparing a stock's closing price with the opening price and then added or subtracted volume based on the degree to which the stock closed above or below its open.
Then Marc Chaikin entered the scene. Instead of using the opening price like Williams, he (Chaikin) used the mean price (the midpoint of the day's action). Chaikin believed that if a stock closed in the upper half of its trading range on a particular day and volume was strong, the stock was being accumulated, but if the stock closed in the lower half of its range, it was being distributed. Based on whether a stock closed in its top or bottom half, Chaikin would either add or subtract volume.
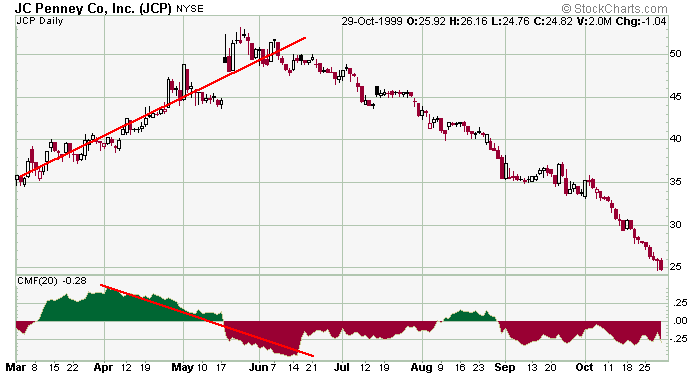
As with other indicators, Chaikin suggested looking for a divergence between the pricing action and the oscillator. If a stock trends up while the CMF rolls over and heads down, the stock will very likely top out soon after. On the other hand , if a stock trends down while the CMF bottoms out and begins to move up, the stock will very likely follow.
The values of the CMF can also be used to indicate buying and selling pressure. Values that bounce between 0.1 and -0.1 and otherwise hang around the zero line are not strong enough to offer a bullish or bearish signal. Values above 0.1 and below -0.1 are indicative of buying and selling pressure respectively while values above 0.25 and below -0.25 are indicative of strong buying and selling.
|