HOME ABOUT ARCHIVES MASTERCLASS BLOG SUBSCRIBE   SIGN IN


Accumulation/Distribution Line
ADX (Wilder's DMI)
Average True Range (ATR)
Chaikin Money Flow (CMF)
Chaikin Oscillator
Commodity Channel Index (CCI)
Comparative Relative Strength
MACD
MACD Histogram
Momentum
On Balance Volume (OBV)
Price Oscillator (PPO)
Rate of Change (ROC)
Relative Strength Index (RSI)
Stochastic Oscillator
Volume
Volume Oscillator (PVO)
Williams %R

print this page
send to a friend

Momentum

The Momentum indicator measures the rate of change of a stock over a specified period of time. One could say it indicates the velocity of a move. Where the ROC displays this as a percentage, Momentum displays it as a ratio.

Momentum can be used to trade trends (i.e. buy when oscillator bottoms and turns up and sell when the oscillator tops and starts to fall).

But often when Momentum reaches extreme levels, although a reversal in prices may be near, one should assume the trend will continue.


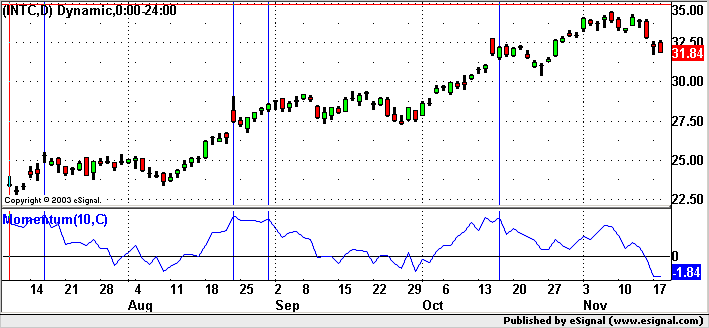
This INTC chart shows how Momentum acts (or causes the underlying stock to act depending on your perspective) during a solid uptrend. As INTC rallied, Momentum moved up thus confirming the move. But when Momentum reached a peak level, a signal was given that the stock wasn't necessarily going to reverse, but some sideways trading was in order. Each time Momentum peaked, INTC moved sideways.


» back to top