HOME ABOUT ARCHIVES MASTERCLASS BLOG SUBSCRIBE   SIGN IN


Accumulation/Distribution Line
ADX (Wilder's DMI)
Average True Range (ATR)
Chaikin Money Flow (CMF)
Chaikin Oscillator
Commodity Channel Index (CCI)
Comparative Relative Strength
MACD
MACD Histogram
Momentum
On Balance Volume (OBV)
Price Oscillator (PPO)
Rate of Change (ROC)
Relative Strength Index (RSI)
Stochastic Oscillator
Volume
Volume Oscillator (PVO)
Williams %R

print this page
send to a friend

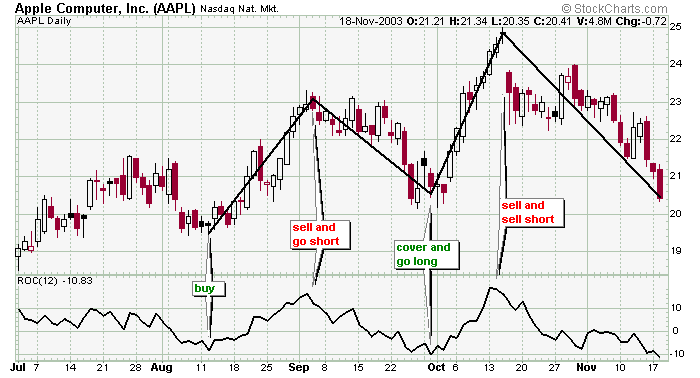
ROC (Rate of Change)

The Rate of Change is an oscillator that indicates the change in price between “today” and the price x periods ago. So the 10-day ROC is the percentage change in price between today's closing price and the closing price 10 days ago.

The ROC is generally used as a short-term overbought or oversold indicator. The higher the ROC goes, the more overbought the underlying is and the more likely a pullback will occur. The lower the ROC goes, the more oversold the underlying stock is, and a bounce is due.

But like many other indicators one needs to do his/her homework to determine historically what ROC values are typically high or low for a particular stock.


Here is a great example of ROC being used as an overbought/oversold indicator. If you would have bought each time the indicator bottomed and moved up and then sold and went short each time the indicator peaked and moved down, you would have done very well.


Here's how ROC could be used in an uptrending stock. Notice how buy signals were given just before the stock rallied and sell signals were given at the beginning of a sideways consolidation period.


» back to top