|
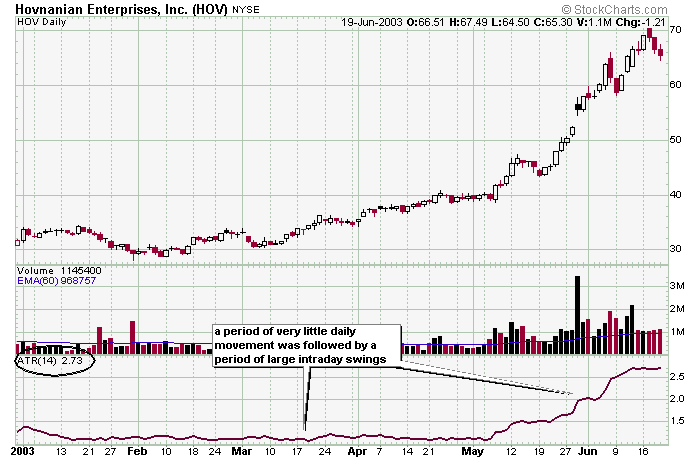
This HOV daily chart shows how ATR is typically displayed. Notice while the stock was churing around for the first few months of the chart, the ATR was low, but when the stock started to move, its ATR also moved up signifying a much more lively and active stock.
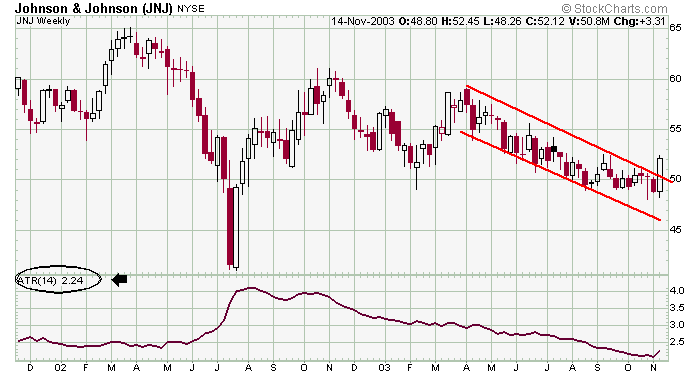
Here is a weekly chart of JNJ. Notice how the stock become less volatile as it dropped, and that a pick up in volatility may signal and end to the down trend.
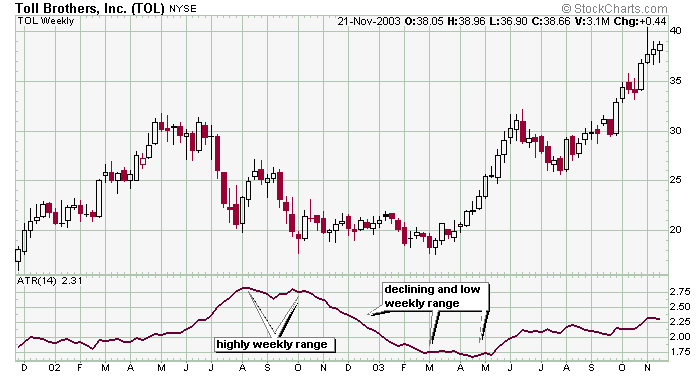
This TOL chart shows how a relatively high ATR reading can often signal a short term top (buyers are exhausted) while a low volatilty reading can signal a bottom.
» back to top
|