HOME ABOUT ARCHIVES MASTERCLASS BLOG SUBSCRIBE   SIGN IN


Accumulation/Distribution Line
ADX (Wilder's DMI)
Average True Range (ATR)
Chaikin Money Flow (CMF)
Chaikin Oscillator
Commodity Channel Index (CCI)
Comparative Relative Strength
MACD
MACD Histogram
Momentum
On Balance Volume (OBV)
Price Oscillator (PPO)
Rate of Change (ROC)
Relative Strength Index (RSI)
Stochastic Oscillator
Volume
Volume Oscillator (PVO)
Williams %R

print this page
send to a friend

CCI (Commodity Channel Index)

The Commodity Channel Index, which can be used effectively for stocks, not just commodities, was developed by Donald Lambert. It is meant to decipher a stock's trendiness. The faster the indicator is moving the stronger the trend is, and if the CCI bounces around in a small range, it simply indicates the lack of a trend.

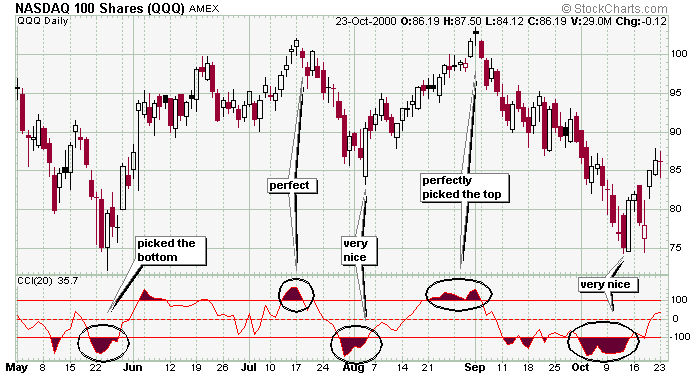
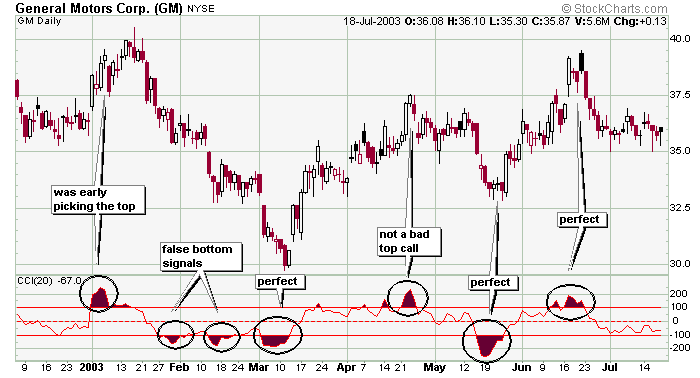
The CCI can be used as an overbought/oversold indicator. Readings above 100 imply an overbought situation and a possible pullback while readings under -100 imply an oversold condition and a possible reversal bounce.

The CCI can also be used as a divergence. If a stock makes a new high but the CCI fails to follow suite, a warning is given that a pullback is likely.


This QQQ chart shows how CCI can be used as an overbought/oversold signal. The indicator is not perfect, but if you bought when the CCI fell below -100 and then moved up and sold when the CCI moved above 100 and then fell, you would have done pretty well.


Here is another example of the CCI being used to determine entries and exits. Again, it's not perfect, but when used with other indicators, it has a place in your technical analysis library.


» back to top