PPO (Price Oscillator)

The Price Oscillator is a momentum indicator that plots the difference between two moving averages. It is identical to the MACD except the MACD typically uses the 26-day and 12-day EMAs while the PPO allows the user to select which two EMAs to use. Also, while the MACD uses points, the PPO uses percentages. Nevertheless, if you eliminate the scale on the side of the chart, one will get the exact same result with either one.
The PPO is most effective in wide-swinging trending markets and tends to lag price movements. It has a couple popular uses.
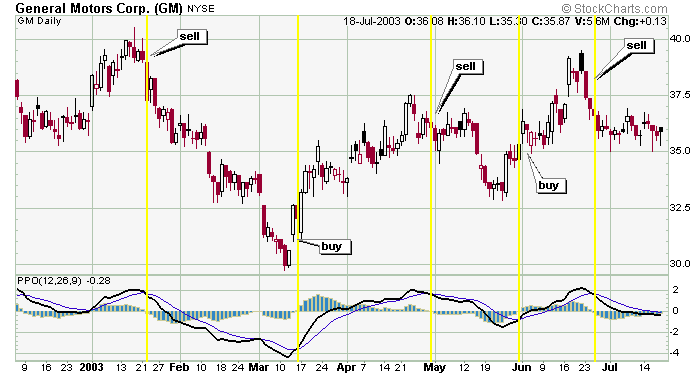
• Crossovers – some traders will buy when the PPO crosses up over its signal line and sell or sell short when it cross down through its signal line. They will also look to buy and sell when the PPO crosses up or down through the zero line.
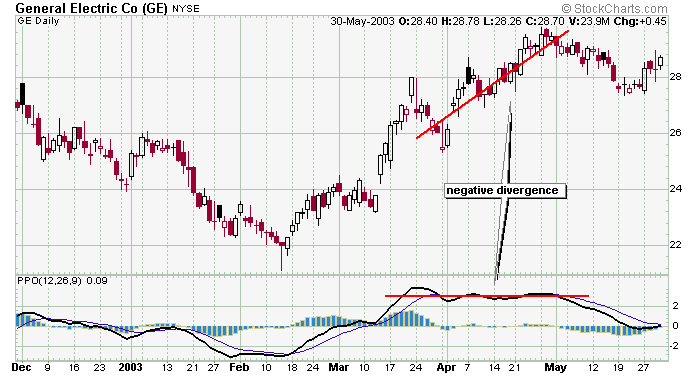
• Divergence – The PPO will generally lag the underlying slightly (i.e. when a stock moves up so will the PPO but slightly delayed), but when a divergence occurs where the PPO fails to confirm the underlying issue's movement, the stock price typically reverses. So if a stock is rallying and the PPO tops out and starts to head down, a big hint is being given that the stock too will top out soon. On the other hand, if a stock falls but the PPO flattens out and starts to move up, a near-term bottom in the stock is likely. |