|
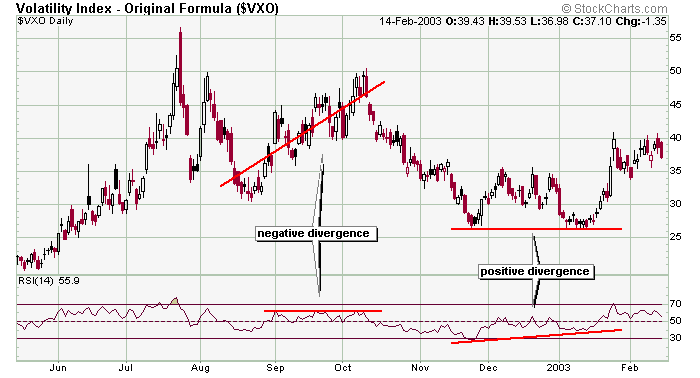
The most powerful usage of RSI is when a divergence forms. Here you can see the VXO was moving up but its RSI was flat. When this happens the indicator usually wins, and it did. VXO fell. The a positive divergence formed. VXO was trading flat while the RSI had started to move up.When the RSI bounced off support, so did the underlying index, and when the RSI made a higher high, the VXO did too.
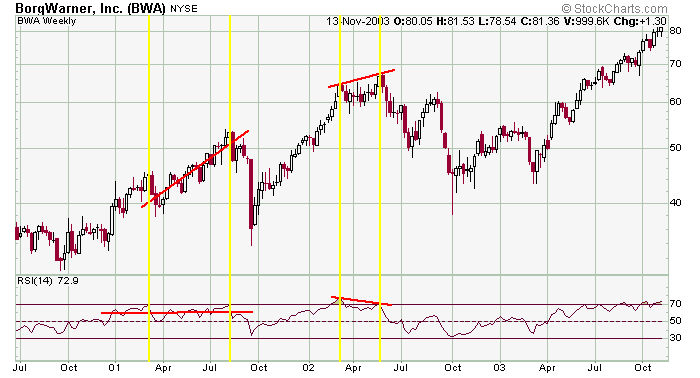
This BWA weekly chart shows two negative divergences which both worked great. In both cases the stock was trending up while the RSI did not confirm the move. In the first case, the RSI was flat while the second scenario shows the RSI had already started to move down.
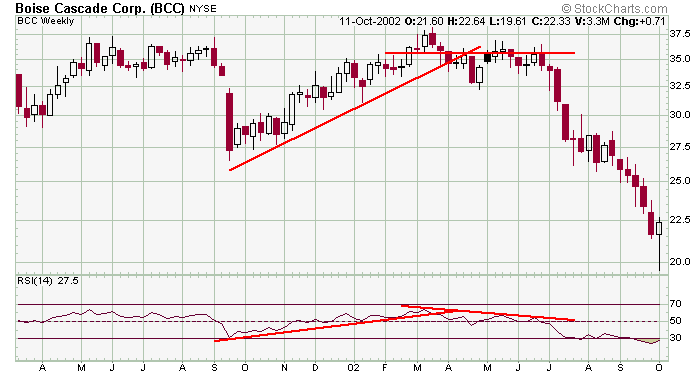
The middle of this chart shows a confirming RSI. The stock moved up and so did the indicator. Then the stock flattened out, but the RSI was more aggressive to the downside. The stock, as they often do, did as the indicator did.
» back to top
|