Stochastic Oscillator

The Fast Stochastic Oscillator was developed by George Lane . It compares a stock's closing price with its price range over a given period of time. Lane observed that as prices move up, closing prices tend to be in the upper end of its range and when prices move down, stocks tend to close in the bottom part of its range.
The Fast Stochastic is displayed as two lines. The main line (%K) is displayed as a solid line. The second line (%D) is the moving average of %K and is displayed as a dotted line.
There are 3 ways the Stochastic is typically used.
• When the Stochastic (either %K or %D) rallies above a specific value (80 is often used) and then falls below that value, a sell signal is given. When the Stochastic falls below a value (20 for example) and then rises above it, a buy signal is offered.
• A buy signal is given when %K crosses above %D and a sell signal is indicated when %K falls below %D.
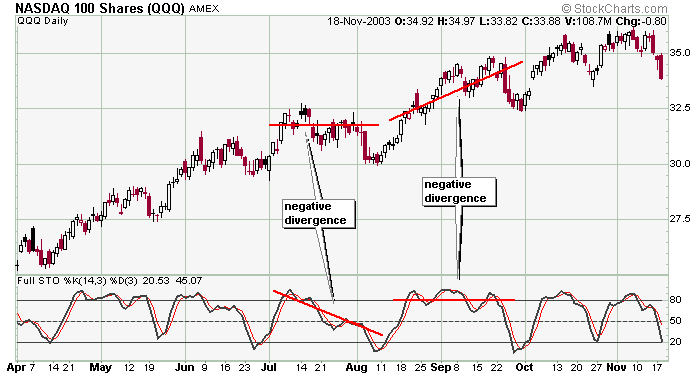
• Divergences between the underlying issue's price movement and the Stochastic also offers good buy and sell signals. If prices move up but the Stochastic does not, prices may reverse at least in the short term. If prices move down but the Stochastic starts to turn up, prices very likely will bottom and reverse.
The Stochastic works best in wide-swinging markets and typically does not work well in a trending market. As with many indicators, the prudent trader needs to do his/her homework to see which stocks can be traded using the Stochastic Oscillator and for which stocks the indicator is useless.
|