Covered Strangle

Risk: limited but very big
Reward: limited
General Description
Entering a covered strangle entails selling a strangle (sell (1) lower strike put and sell (1) higher strike call) on a stock you own. It's similar to a covered straddle except consecutive strikes are used instead of the same strike. It can also be thought of as a combination of a covered call and naked put, which have the same risk profile. Hence, it's like employing two covered calls or two naked puts.
(draw a covered strangle risk diagram here)
The Thinking
You're moderately bullish and are confident a stock's downside is limited. This strategy is a combination of a covered call and naked put, which have the same risk profile. If you use out-of-the-money options and the stock trades flat, you'll keep all of the call and put premiums and will also keep the stock. If the stock moves up, you'll keep the option premiums, and the stock will get "called" from you if it closes above the call strike. If the stock moves down, you'll again keep the option premiums, but you'll get "put" the stock, so you'll now be long twice as many shares.
Example
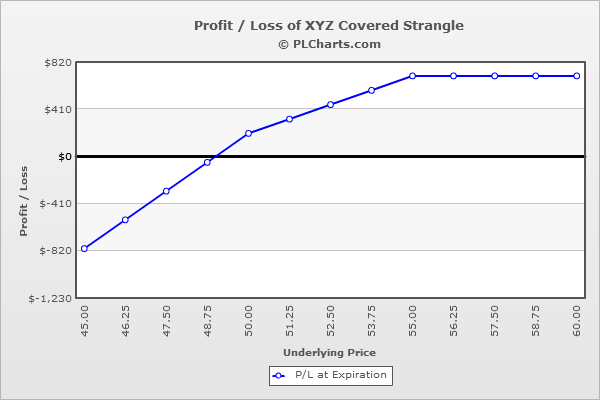
XYZ is at $52. You're confident the stock will bounce around in a small range or move up slightly. To profit, you buy 100 shares of the stock at $52.00 and sell (1) 55 call for $2.00 and (1) 50 put for $2.00. The net credit is $4.00 plus the cost of the stock.
If the stock closes above $55, you'll keep the option premiums for a $4.00 profit, and the stock will get called away (bought at $52.00, sold at $55.00 (the call strike) for a $3.00 profit). The net of this is a $7.00 profit.
If the stock closes between $50 and $55, the put and call will expire worthless (you keep the premiums) and you keep the stock.
If the stock closes below $50, your loss can add up fast. You’ll lose money with both the long stock position and the short put. For example at $40, you’ll be down 12 bucks with the stock and $8.00 with the put (you sold it for $2.00, now it’s worth $10). You do have a little extra buffer from the $2.00 collected from selling the call.
The PL chart below graphically shows where this trade will be profitable and at a loss.

|

