Long Put Butterfly

Risk: limited
Reward: limited
General Description
Entering a long put butterfly entails buying (1) lower strike put, selling (2) middle strike puts and buying (1) higher strike put (same expiration month, strikes are equal distance). It's essentially a combination of a lower strike bull put spread and a higher strike bear put spread, and it's similar to a long put condor except the short puts use the same strike.
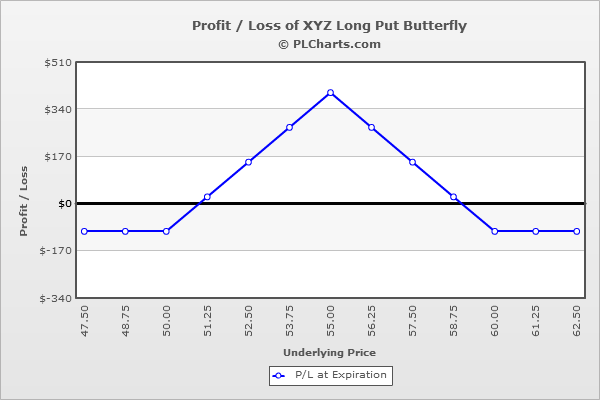
(draw a long put butterfly risk diagram here)
The Thinking
You're confident a stock will trade in a tight range and not move much from its current position. You employ a lower strike bull put spread, which achieves max profitability when the underlying rallies, and a higher strike bear put spread, which achieves max profitability when the underlying drops. If you're correct, if the stock doesn't stray too far from the middle strike, you'll make money on both legs of the overall strategy.
Example
XYZ is at $55.00, and you're fairly certain the stock won't move much. You buy (1) 50 put for $1.00, sell (2) 55 puts for $3.00 each and buy (1) 60 put for $6.00. The net debit is $1.00.
Above the highest strike, all puts expire worthless, and your loss is the net debit paid when the trade was initiated.
Below the lowest strike, all puts are in-the-money and exactly cancel each other out. Your loss is the net debit paid when the trade was initiated. For example, if the stock is at $45, the 50 put will be worth $5 ($4.00 profit), the 55 puts will be worth $10 ($7.00 loss per contract) and the 60 put will be worth $15 ($9.00 profit). The net of this is a $1.00 loss.
At $55 (middle strike), max profitability is achieved. The 50 put will be worthless ($1.00 loss), the 55 puts will be worthless ($3.00 profit per contract) and the 60 put will be worth $5 ($1.00 loss). The net of this is a $4.00 profit.
The PL chart below graphically shows where this trade will be profitable and at a loss.

|

