Short Put Ratio Spread

Risk: limited but very big
Reward: limited
General Description
Entering a short put ratio spread entails buying higher strike puts and selling twice as many lower strike puts (same expiration month). It can be thought of as a long put ladder, but instead of the short puts being staggered, they use the same strike. It's also similar to a put ratio spread, but the ratio of short to long puts is locked 2:1.
(draw a short put ratio spread risk diagram here)
The Thinking
Your research tells you a stock has modest downside potential but will not collapse and will not experience a big expansion in volatility. You enter a bear put spread to profit from such movement and then double up on your short put leg at the lower strike. This helps finance the trade and results in a more favorable breakeven level.
Example
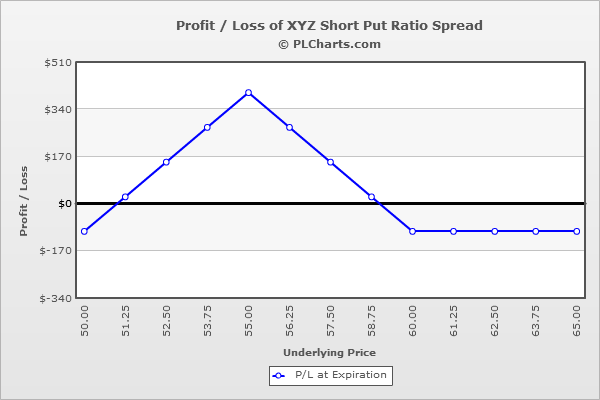
XYZ is at $57.50. You think the stock could move down a couple points but a big move down is not in the cards. You buy (1) 60 put for $5.00 and then sell (2) 55 puts for $2.00 each. The trade is initiated for a net debit of $1.00.
Above the highest strike, all puts expire worthless, and your profit or loss is the net credit or net debit; in this case it’s a $1.00 loss.
At $55, your max profitability occurs. The 60 puts will be worth $5 (breakeven), and the 55 puts will expire worthless ($2.00 gain per contract). The net of this is a $4.00 profit.
Below $55, the loss from one of your short puts will be countered by a gain from the long put, and the one remaining short put will lose you money point-for-point with the underlying. For example, at $50, the 60 put will be worth $10 ($5 gain), and the 55 puts will be worth $5 ($3.00 loss per contract). The net is a $1.00 loss.
The PL chart below graphically shows where this trade will be profitable and at a loss.

|

