Long Call Ratio Spread

Risk: limited
Reward: unlimited
General Description
Entering a long call ratio spread entails selling a lower strike call and buying twice as many higher strike calls (same expiration month). This is the same as a call backspread except the ratio of long calls to short calls is locked at 2:1.
(draw a long call ratio spread risk diagram here)
The Thinking
You're bullish and believe a stock has big upside potential. But instead using a long call strategy, which has a high cost of entry, you use a long call ratio spread, which has a much lower initial cost (possibly a net credit) but still has unlimited profit potential. Essentially you are using the proceeds from the short call leg to pay for the long call leg. If you're wrong and the stock drops, you won't lose much, if anything, because as an added bonus, depending on how the trade is constructed, you may be able to initiate the trade for a net credit.
Example
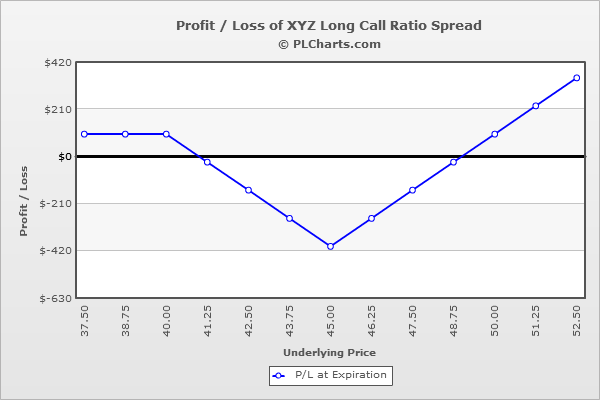
XYZ is at $43, and you believe it has big upside potential - so big that you are willing to roll the dice with out-of-the-money long calls - but you'd like to lessen the loss incurred should the stock drop. You buy (2) 45 calls for $1.25 each and sell (1) 40 call for $3.50. This trade is entered for a net credit of $1.00 (you collected $3.50 for the short call and paid $1.25 for each of the long calls).
Below $40, all calls expire worthless, and your gain is the net credit received when the trade was initiated.
At $45, your max loss occurs. You lose money on the long calls (you bought them for $1.25, now they're worthless) and the short call (you sold it for $3.50, now it's worth $5.00). So the total loss is $4.00.
Above $45, the profit from one of your long calls will be canceled out by the loss from the short call, but you'll make money point-for-point with the other long call (once the stock is above breakeven).
Compared to a long call, a long call ratio spread gives you some down protection (in this example you turned a profit when the stock dropped), but your upside is reduced, your breakeven level is less favorable and your loss, should the stock not experience a big move, is greater.
The PL chart below graphically shows where this trade will be profitable and at a loss.

|

